
Industry Knowledge
China Lighting Exports Reach US$37.7 Billion in Q1–Q3 2026: What the Customs Data Means for Buyers
China Customs data for January–September 2026 show lighting exports of about US$37.7 billion, down 0.7% year on year, while light source volume rose 18% and LED modules surged 49%. Africa and Europe grew, US luminaires fell 8%, and Guangdong plus Zhejiang supplied two thirds of national exports.
China exported about US$37.7 billion of lighting products in the first three quarters of 2026, down around 0.7% year on year and equal to 1.7% of the country's total electromechanical product exports. The figures come from China Customs statistics summarised in a preliminary industry briefing published by the China Association of Lighting Industry (CALI) on 20 October 2026.
The headline is flat. The detail underneath is more useful for importers and distributors: shipment volumes are climbing faster than export value, LED modules are winning a larger share of the trade, and demand is moving in opposite directions from region to region.
A weak start, a stronger third quarter
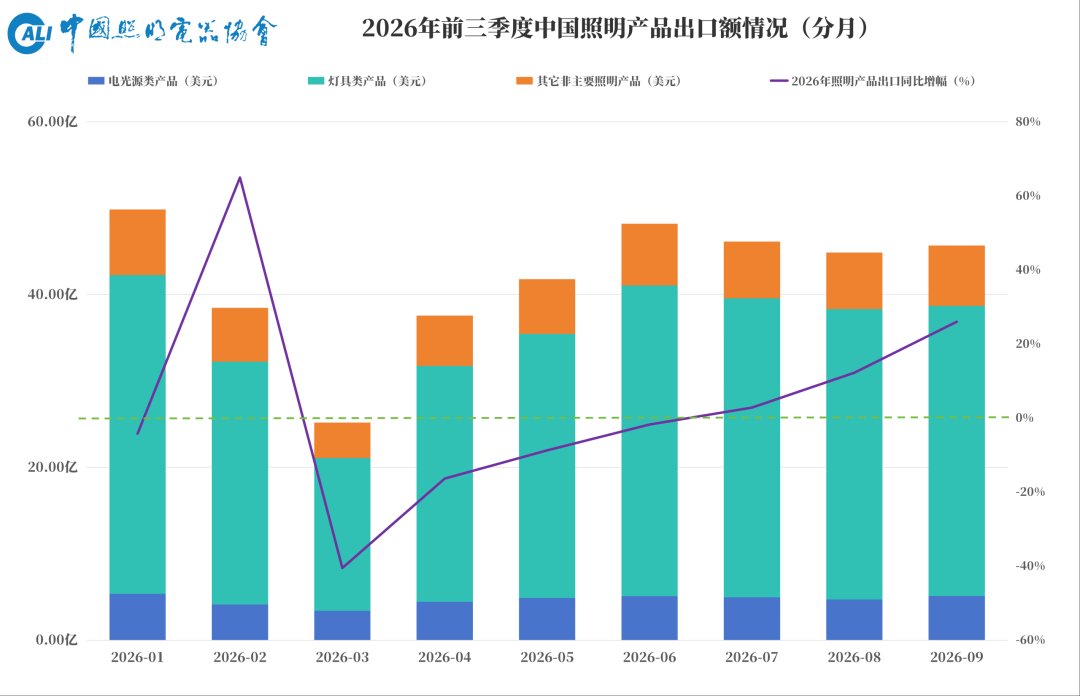
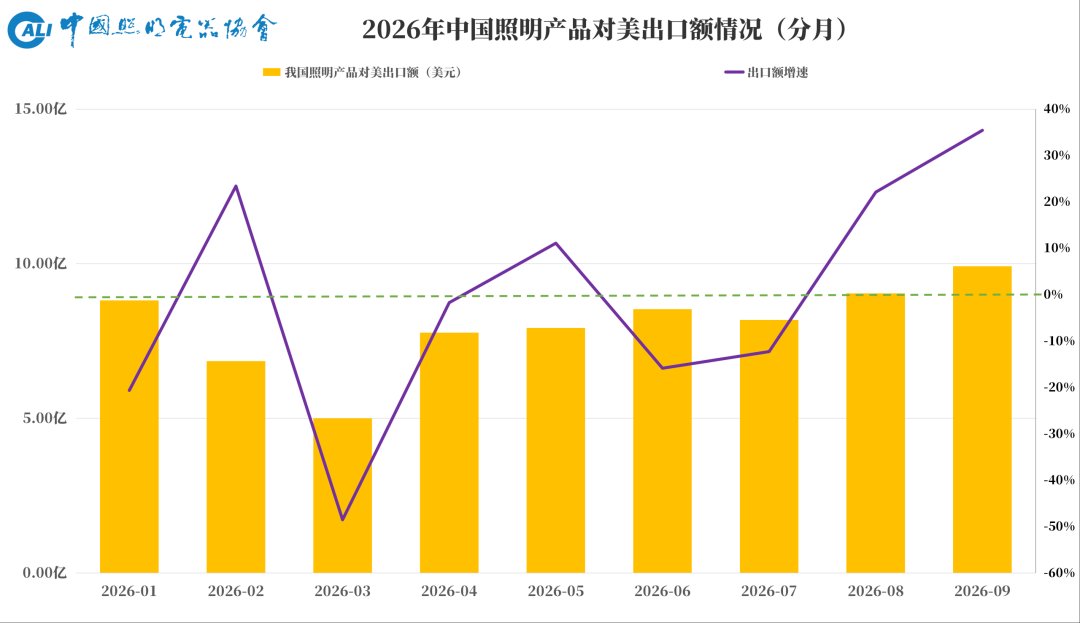
Exports swung in January to March, when the timing of Chinese New Year and a shift in overseas order schedules pulled volumes in both directions. Through the second quarter the monthly declines kept narrowing, and June was roughly level with the same month a year earlier. Every month of the third quarter then posted year-on-year growth, with the rate rising month by month. September alone reached about US$4.6 billion, up 26% on September 2025.
Product mix: less value, more volume
Light sources, meaning bulbs, tubes and modules, accounted for about US$4.1 billion, down around 2%. Luminaires accounted for about US$27.9 billion, also down around 2%. Inside luminaires, finished decorative categories lost the most value: fixed luminaires fell about 12% and portable luminaires about 17%.
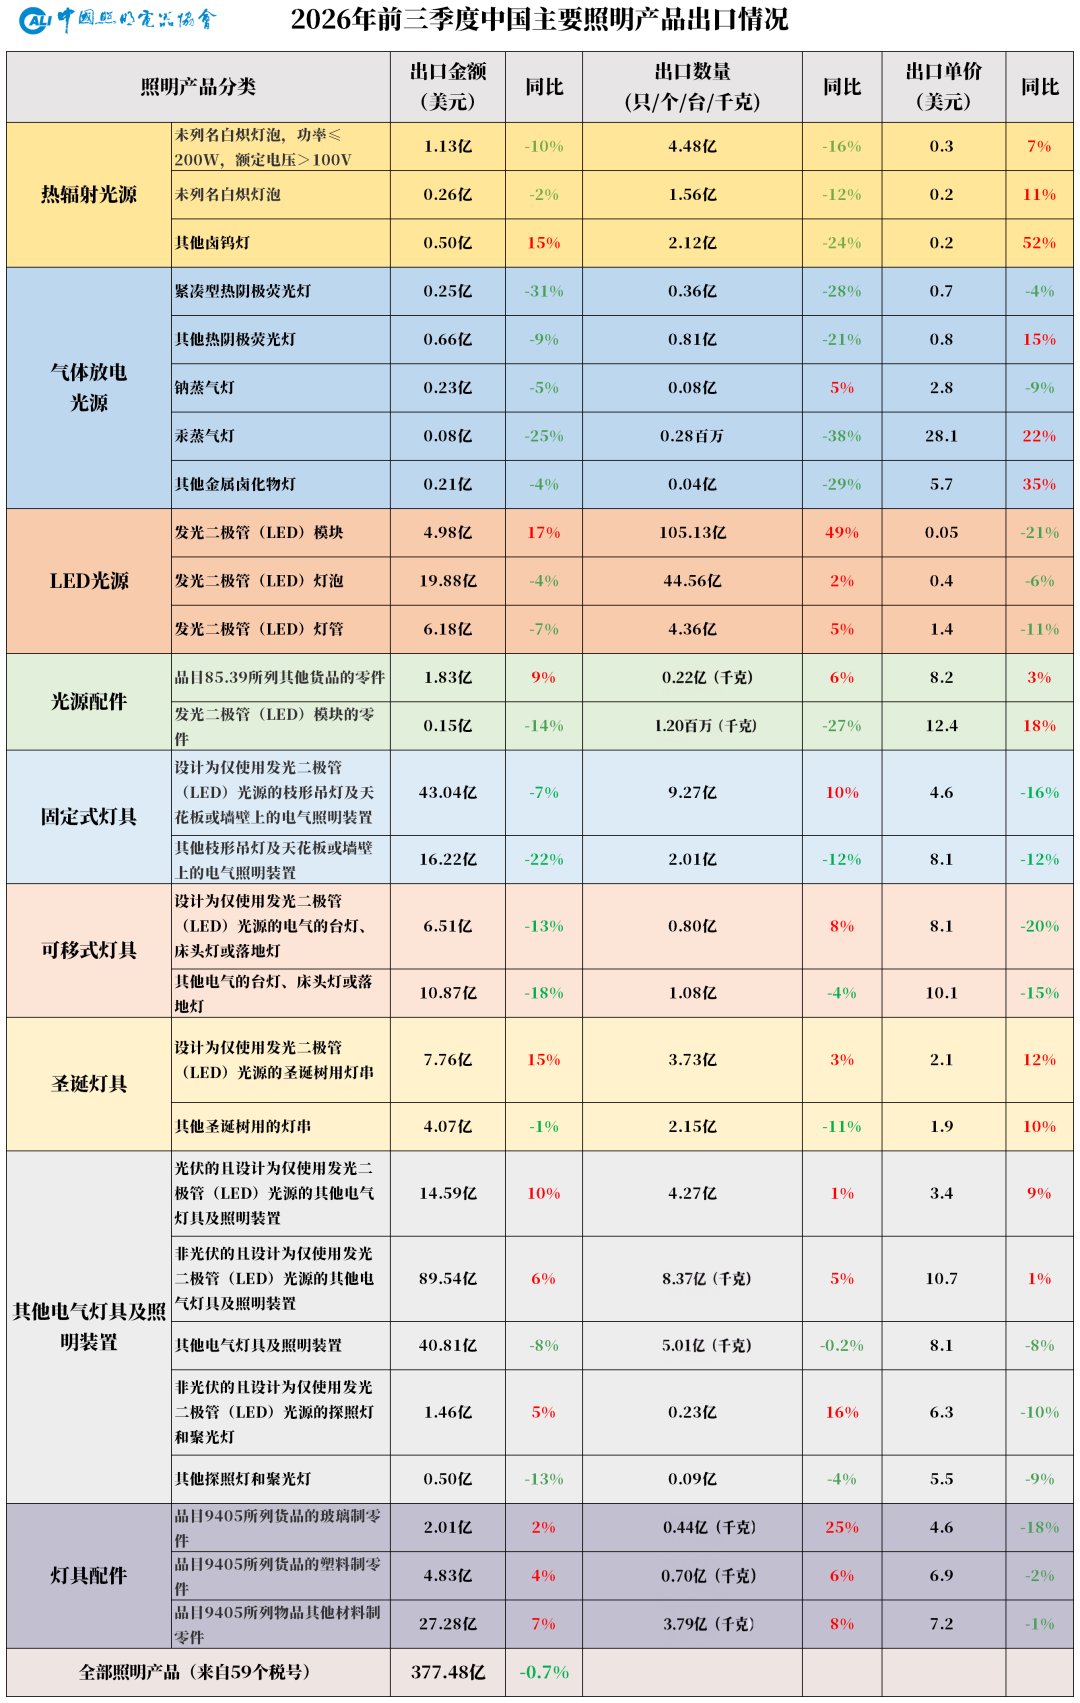
Volumes moved the other way. Light source exports reached about 21.4 billion units, up 18%, with LED bulbs up 2%, LED tubes up 5% and LED modules up 49%. On the luminaire side, LED fixed luminaires grew 10% in volume, LED portable luminaires 8%, and other LED-only non-solar lamps and lighting fittings 5%.
The gap between value and volume is a price story. Unit prices fell in all three large LED categories of the association's product table:
Selected LED categories, January to September 2026. Source: CALI. Original chart values are stated in 100 million US dollars. | ||||||
Category | Export value | Value change | Volume | Volume change | Unit price | Price change |
|---|---|---|---|---|---|---|
LED modules | US$498 million | +17% | 10.51 billion pcs | +49% | US$0.05 | -21% |
LED bulbs | US$1.99 billion | -4% | 4.46 billion pcs | +2% | US$0.40 | -6% |
LED tubes | US$618 million | -7% | 436 million pcs | +5% | US$1.40 | -11% |
Two pockets went the other way. Average unit prices for LED bulbs, LED Christmas tree light strings, other Christmas tree light strings, and solar-powered LED lamps and lighting fittings rose more than 11% against the first quarter of 2026. Solar LED lamps and fittings, and LED Christmas tree light strings, grew in value, volume and unit price at the same time.
Africa and Europe are carrying the growth
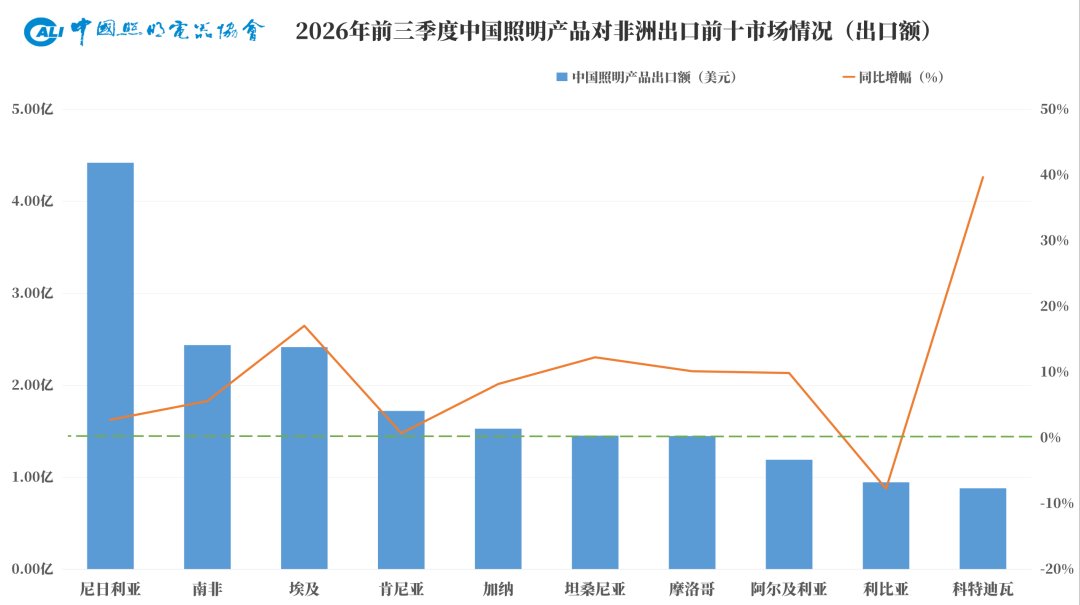
Africa took about US$2.8 billion, up 11%, lifting its share of China's lighting exports to roughly 8%, one percentage point higher than a year earlier. Egypt, Tanzania, Morocco and Algeria each grew more than 10%.
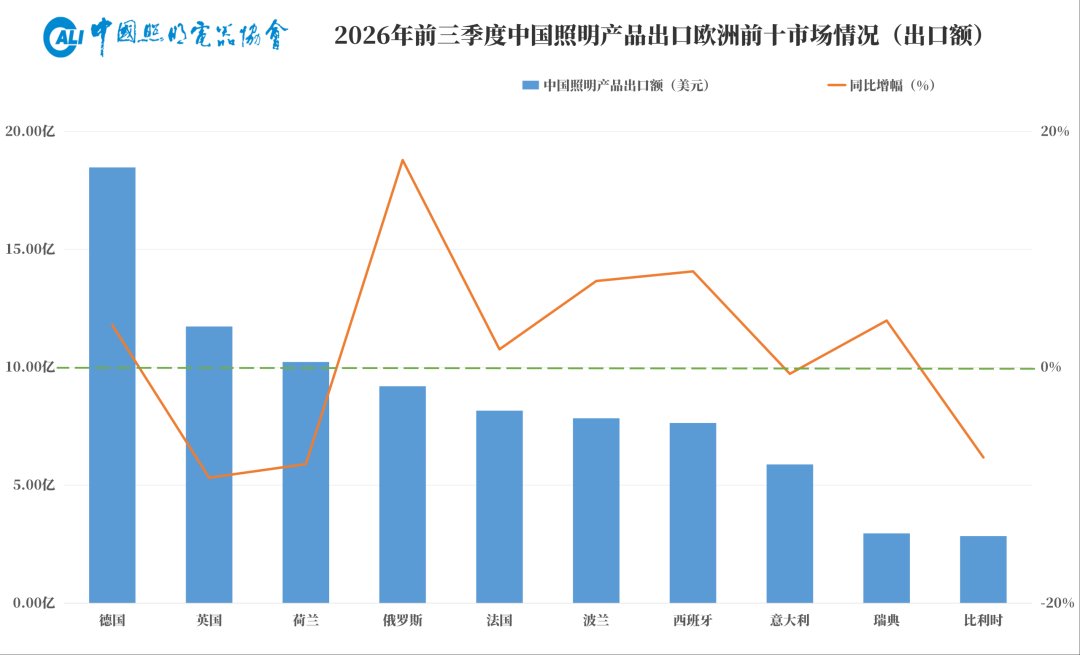
Europe took about US$10.1 billion, up 1%. Germany, Russia, France, Poland, Spain and Sweden all grew more than 4%.
The United States: value still down, September sharply up
Exports to the United States reached about US$7.2 billion, down 5%, but that decline was four percentage points narrower than at the end of August. September alone came to about US$1.0 billion, up 35% year on year.
The split inside the US number matters. Light sources came to about US$0.9 billion, up 3%, and the association attributes that gain to higher unit prices for legacy products such as incandescent and fluorescent lamps rather than to volume. Luminaires came to about US$5.1 billion, down about 8%.
One strong month is not a trend. Buyers building 2027 programmes should first establish whether the September rebound was distributor restocking, a shift in order timing, or a genuine change in demand.
Production stays concentrated in Guangdong and Zhejiang
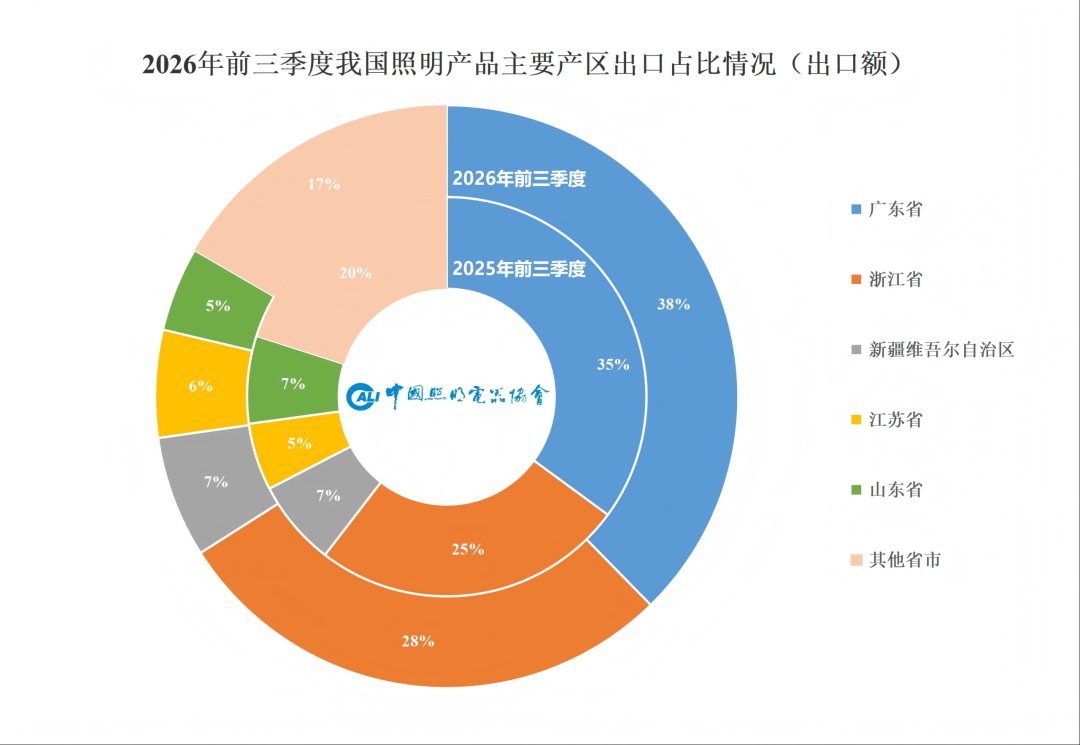
Guangdong exported about US$14.2 billion, up 7%, or 38% of the national total, ranking first among all provinces. Zhejiang exported about US$10.6 billion, up 11%, or 28%. Jiangsu and Shanghai grew more than 9%. Xinjiang and Shandong fell more than 4%.
What the data means for lighting buyers
Price pressure sits in components, not in finished systems. LED module volume grew 49% while module value grew 17%. Buyers who specify the driver, housing and colour consistency themselves can hold a landed-cost target instead of accepting whatever bill of materials a supplier quotes.
Volume growth is not the same as demand growth. Total lighting exports slipped 0.7% in value while light source volume rose 18%. When a quote comes in lower per unit, confirm lumen output, colour tolerance and driver specification before comparing it with the incumbents.
Different regions need different assortments. Africa is growing on volume-driven categories for distribution and project work, Europe is growing slowly and largely through share shifts between suppliers, and the United States is still contracting in luminaires. One catalogue for all three usually gives away margin in at least one of them.
Seasonal and solar categories are the exception. Christmas light strings and solar LED lamps and fittings are the groups raising price, volume and value together, which supports firmer quotations and earlier booking for seasonal programmes.
Where Enshine Lighting sits in this picture
Enshine Lighting has manufactured LED lighting in Fujian, China since 2006 and supplies lighting brands and distributors on an OEM and ODM basis. Plastic injection, aluminium stamping, die casting, LED driver assembly and finished product assembly are handled in house under an ISO 9001 quality management system.
Several categories that grew in this data are part of the current Enshine range: LED bulbs, ultra-slim LED panel lights, IP65 LED floodlights and all-in-one solar street lights.
If you are reviewing a 2027 assortment or renegotiating unit prices against these trends, send us the category, target market and volume you have in mind and we will quote against your specification.
Notes on the data
All figures are preliminary and are based on China Customs statistics for January to September 2026, first published by the China Association of Lighting Industry on 20 October 2026. The association intends to publish a fuller analysis in its 2026 China Lighting journal. In this article, light sources covers bulbs, tubes and modules, and luminaires covers fixed, portable and other finished fittings, following the association's categories. The charts are reproduced from the original briefing with their Chinese labels unchanged; values shown as 100 million US dollars have been converted to US dollars in the text.